Understanding price charts is essential for anyone looking to navigate the financial markets. Whether you’re a seasoned trader or just starting, the ability to interpret price movements is crucial for making informed decisions. This comprehensive guide delves into the intricacies of reading price charts bar by bar, empowering you to unlock valuable insights and enhance your trading strategies. We’ll explore the fundamental elements of bar charts and equip you with the knowledge to decipher market trends, identify potential trading opportunities, and refine your analytical skills.
Deconstructing the Bar: Anatomy of a Price Bar
Before diving into the complexities of chart patterns and indicators, it’s paramount to understand the basic building block of a price chart: the bar. Each bar on a chart represents a specific timeframe, whether it’s a minute, hour, day, or week. This timeframe is crucial as it dictates the granularity of price information displayed.
A typical price bar comprises four key data points:
- Open: The price at which the asset traded at the beginning of the specified timeframe.
- High: The highest price reached during the timeframe.
- Low: The lowest price reached during the timeframe.
- Close: The price at which the asset traded at the end of the timeframe.
These four points provide a visual representation of the price action within that particular timeframe, offering insights into the balance between buyers and sellers.
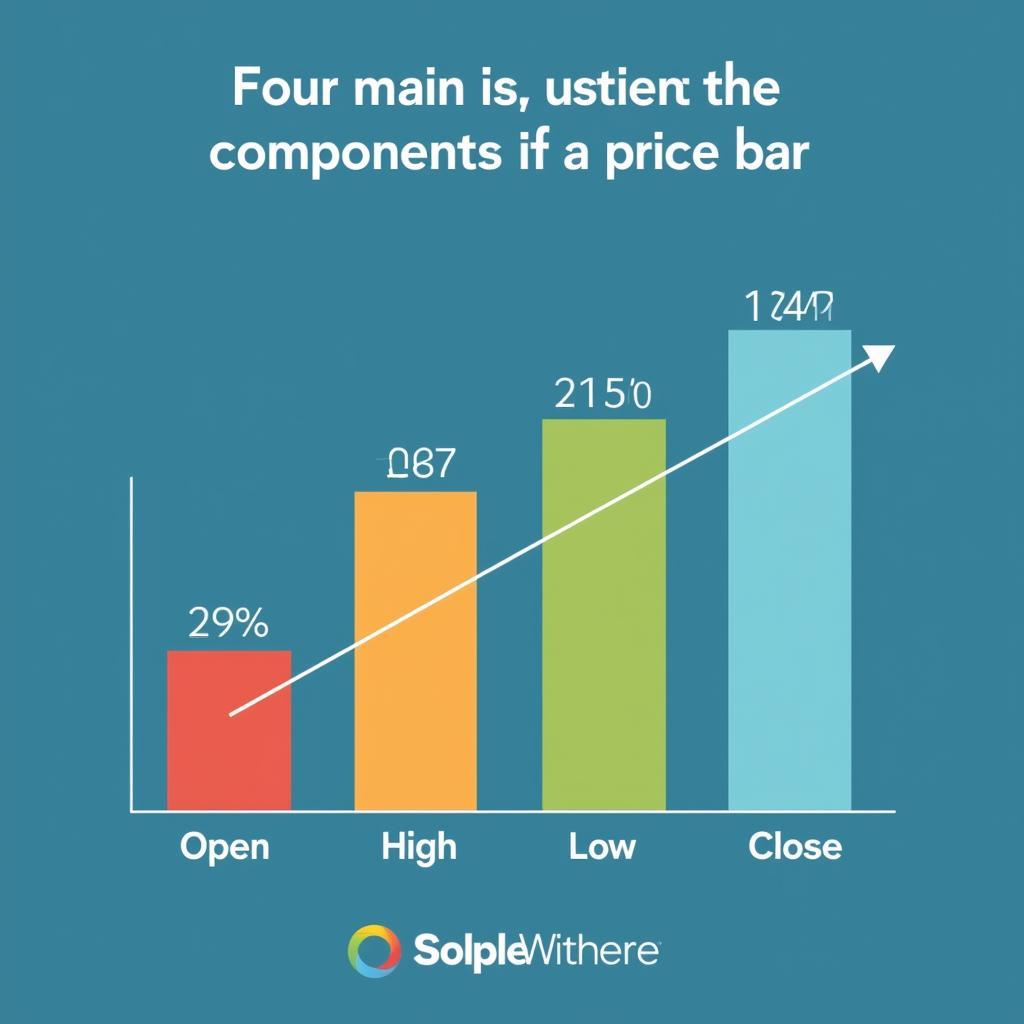 Anatomy of a Price Bar
Unraveling the Story: Reading Price Bars in Context
Examining individual price bars in isolation provides limited information. The true power of bar-by-bar analysis lies in understanding the context and relationship between consecutive bars. By observing the formation and sequence of bars, traders can begin to decipher the narrative unfolding in the market.
For instance, a series of bars with consecutively higher highs and higher lows suggests increasing buying pressure and potential upward momentum. Conversely, a series of lower highs and lower lows indicates selling pressure and potential downward movement.
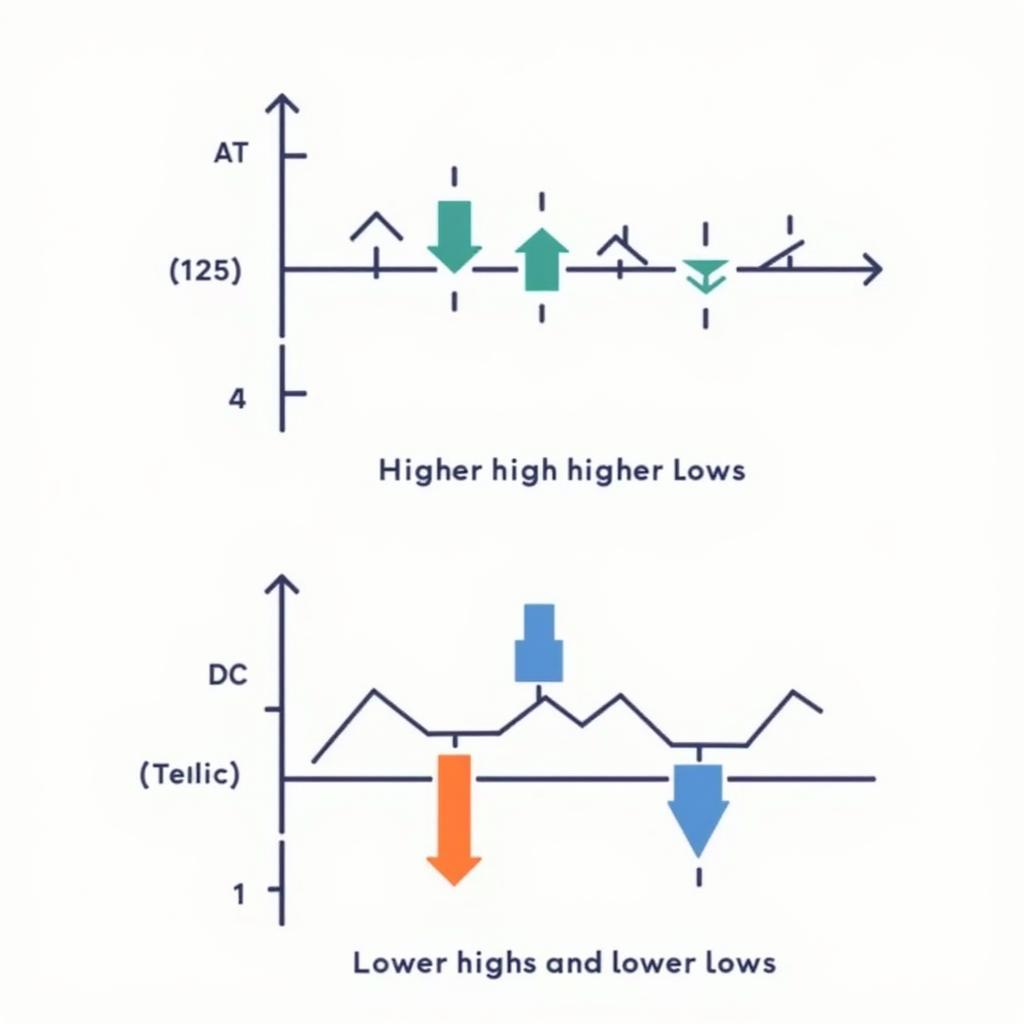 Uptrend and Downtrend Price Bar Patterns
Beyond the Basics: Unveiling Trading Opportunities
Mastering bar-by-bar analysis involves recognizing patterns and formations that signal potential trading opportunities. These patterns, often referred to as candlestick patterns, provide insights into shifts in supply and demand, potential reversals, and breakouts.
Some common candlestick patterns include:
- Doji: A Doji candlestick represents indecision in the market, characterized by a small body with the open and close prices very close together.
- Hammer: A Hammer candlestick suggests a potential bullish reversal, appearing after a downtrend and characterized by a long lower shadow and a small body at the top of the bar.
- Shooting Star: A Shooting Star candlestick indicates a potential bearish reversal, appearing after an uptrend and characterized by a long upper shadow and a small body at the bottom of the bar.
Putting it All Together: Developing Your Bar-by-Bar Analysis Skills
Developing proficiency in reading price charts bar by bar requires consistent practice and a keen eye for detail. Start by familiarizing yourself with common candlestick patterns and their interpretations. Analyze historical charts and identify how these patterns played out. As you gain experience, you’ll develop the ability to recognize subtle nuances in price action, enabling you to make more informed trading decisions.
Conclusion
Mastering the art of reading price charts bar by bar is an ongoing journey that demands patience, discipline, and a commitment to continuous learning. By understanding the fundamental elements of price bars, recognizing candlestick patterns, and developing a systematic approach to chart analysis, you can gain a significant edge in the financial markets.
Remember, successful trading requires a holistic approach that combines technical analysis with fundamental analysis, risk management, and emotional control.
FAQ
1. What timeframe is best for bar-by-bar analysis?
The optimal timeframe depends on your trading style and goals. Shorter timeframes like 1-minute or 5-minute charts are suitable for scalpers, while longer timeframes like daily or weekly charts are preferred by swing traders and investors.
2. Are candlestick patterns reliable indicators?
Candlestick patterns provide insights into potential market sentiment and price movements, but they should not be solely relied upon. Combine candlestick analysis with other technical indicators and fundamental analysis for a comprehensive trading strategy.
3. Can I use bar-by-bar analysis for any financial instrument?
Yes, bar-by-bar analysis can be applied to any financial instrument that has price data represented in chart format, including stocks, forex, commodities, and cryptocurrencies.
4. Is there a free PDF download available for this guide?
While this specific guide is not available for download, numerous resources offer comprehensive insights into candlestick patterns and bar-by-bar analysis. A simple online search for “candlestick patterns pdf free download” or “price action trading pdf” can yield valuable materials.
5. How can I further enhance my chart analysis skills?
Consider exploring advanced technical indicators, backtesting your strategies, and joining trading communities to learn from experienced traders.
Need further assistance? Contact us at:
Phone Number: 0972669017
Email: [email protected]
Address: 142 Trần Nhân Tông, Yên Thanh, Uông Bí, Quảng Ninh, Vietnam
Our dedicated customer support team is available 24/7 to assist you.